- Dec 17
- 25 min read
Global supply chains rarely fail due to a lack of data — they fail because risk is detected too late.
Supplier lead-time volatility, especially for raw materials and critical components, quietly destabilizes planning cycles, inflates inventory buffers, and erodes service levels long before delays become visible in standard KPIs.
Traditional performance reporting explains what went wrong.
What supply chain leaders increasingly need is a way to understand where volatility exists, which suppliers truly matter, and where risk is likely to emerge next.
This article presents a three-model analytical framework designed to address that exact challenge.
What This Framework Enables
By combining diagnostic analysis, supplier classification, and forward-looking risk indicators, this framework helps organizations:
Detect upstream instability early — before service impact occurs
Focus on supplier interventions where exposure and risk truly intersect
Translate variability signals into smarter safety stock and buffer decisions
Reduce reactive firefighting across planning and procurement teams
The models are designed to work together, not in isolation.
Despite global supply chains stabilizing after the pandemic, supplier lead times remain highly unpredictable — creating a “black box” effect in which procurement teams struggle to understand why materials arrive early, late, or inconsistently. This upstream volatility affects production scheduling, inventory accuracy, warehouse receiving readiness, and the overall responsiveness of manufacturing operations.
For many industries, upstream supply reliability has not returned to pre-2020 levels. Instead, suppliers across electronics, automotive, industrial machinery, and consumer goods continue to face fluctuating capacity, transportation unpredictability, and raw-material constraints — all of which make delivery windows increasingly unstable.

A Deloitte analysis of supply-chain performance shows that supplier-side instability and extended lead-times remain one of the biggest operational risks for manufacturers:
“Supply chain shocks continue to reverberate across upstream networks. Lead-time volatility, evolving supplier constraints, and regional disruptions limit manufacturers’ ability to plan with accuracy.”
📎 Source: Deloitte – Global Supply Chain Resilience
The report highlights that even in 2024, inbound material variability remains a structural challenge — not a temporary one.
In another report, the GEP Index — widely used by procurement leaders — shows continued spare capacity, signaling unstable demand–supply matching and unpredictable supplier responsiveness:
“Suppliers continue to operate with spare capacity, and fluctuations persist across transport, materials, and upstream order flows — creating uncertainty in delivery timing.”
📎 Source: GEP – Global Supply Chain Volatility Index
This volatility directly translates into erratic lead times and unreliable replenishment patterns.
Similarly, the global electronics sector — a leading indicator for upstream health — continues to face long and inconsistent lead-times, according to the Electronics Industry Association:
“Rising input costs, fluctuating component availability, and fragmented logistics networks continue to pressure lead-times across semiconductor and electronic component categories.”
📎 Source: Electronics Industry Update 2024
This confirms that upstream delays are widespread, affecting both high-tech and non-tech sectors.
Across these reports, a common pattern emerges:
Suppliers face erratic capacity cycles
Transport delays and route variability create unpredictable arrival times
Manufacturing sectors experience unstable order confirmation windows
Upstream planning data (like promised vs. actual dates) is inconsistent or unreliable
This results in frequent MRP rescheduling, higher buffer requirements, and unplanned expedite requests
In short, lead-time instability is not just a logistics problem — it is a planning, procurement, and data-governance problem.
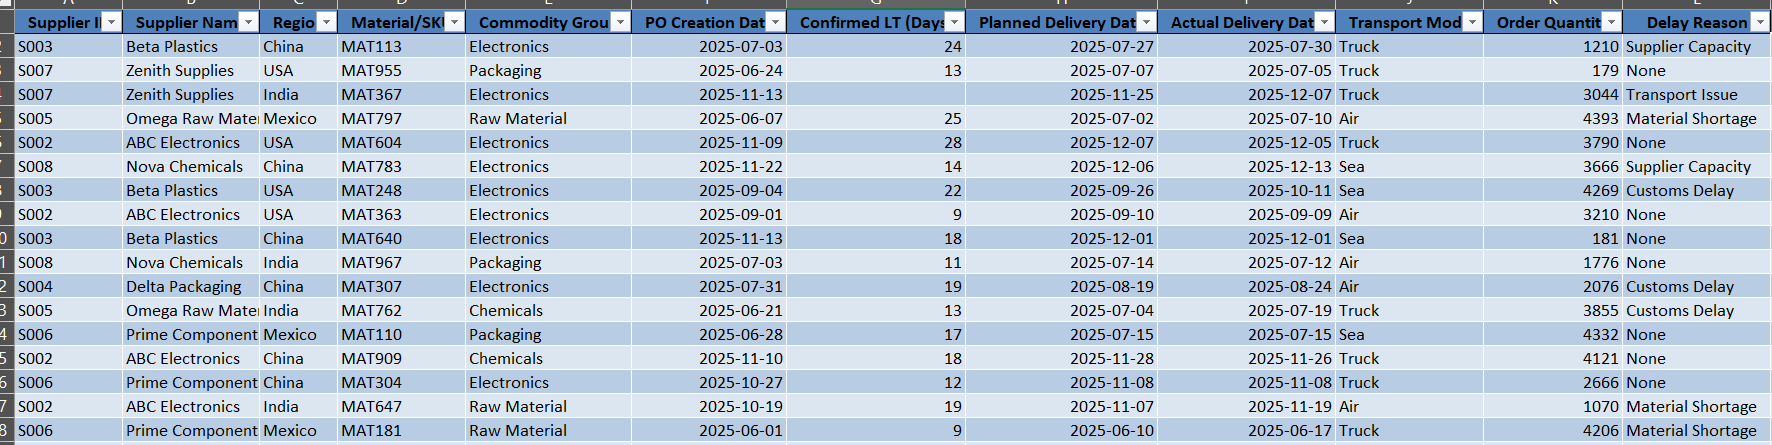
To analyze upstream lead-time volatility and supplier reliability, I developed a representative Supplier Lead-Time Performance Dataset simulating real-world procurement and inbound logistics behavior. Because detailed PO-level lead-time data from ERP systems (such as SAP) is typically proprietary and not publicly accessible, particularly at the supplier–material level, the dataset was intentionally designed as a structured, realistic proxy for enterprise procurement operations.
The dataset consists of 300 purchase-order–level records, capturing upstream sourcing behavior across multiple suppliers, regions, and commodity groups. While modest in size, the dataset is intentionally scoped to reflect operational variability rather than statistical scale, making it well-suited for diagnostic, classification, and risk-indicator modeling.
The dataset structure was defined after reviewing standard upstream procurement and inbound logistics workflows, including PO creation, supplier lead-time confirmation, planned delivery scheduling, transportation execution, and goods receipt processing. These process steps represent the primary points at which lead-time volatility is introduced and often obscured within aggregate performance metrics.
To ensure the dataset reflects real-world conditions, its design was informed by extensive secondary research, including:
Industry studies on post-pandemic supplier lead-time instability
Supply chain and logistics white papers on upstream risk and variability
ERP/SAP documentation related to planned lead times, delivery dates, and master data accuracy
Case studies discussing supplier capacity constraints, transportation unpredictability, and raw-material availability
In addition to desk research, practical operational insights commonly reported by procurement and logistics teams were incorporated to mirror actual challenges, such as:
Persistent gaps between planned and actual lead times
Supplier inconsistency hidden by average lead-time KPIs
Region- and commodity-specific delay patterns
Transportation mode–driven variability
Inaccurate or outdated lead-time master data in ERP systems
Based on these insights, a structured set of base and calculated variables was defined, including Planned Lead-Time, Actual Lead-Time, Lead-Time Variance, On-Time Delivery Flags, Delay Severity Categories, and Supplier Reliability Scores. These variables were selected to capture the drivers of upstream volatility, enabling root-cause diagnosis, supplier classification, and early risk signaling from a single unified dataset.
Although the dataset is simulated and limited to 300 records, it is carefully calibrated to mirror real ERP data structures and procurement behavior. The focus is on depth of operational insight rather than volume, ensuring the resulting analysis reflects practical challenges faced by procurement, logistics, warehouse, and planning teams when managing volatile supplier lead times.
Supplier Raw Dataset
Derives Variables from Raw Data
| Planned Lead-Time (Days) | Actual Lead-Time (Days) | Lead-Time Variance (Days) | On-Time Delivery Flag | Delay Category | Severe_Flag | Supplier_Reliability_Score |
| 24 | 27 | 3 | 0 | Minor | 0 | D |
| 13 | 11 | -2 | 1 | On-Time | 0 | B |
| 12 | 24 | 12 | 0 | Severe | 1 | B |
| 25 | 33 | 8 | 0 | Moderate | 0 | B |
| 28 | 26 | -2 | 1 | On-Time | 0 | D |
| 14 | 21 | 7 | 0 | Moderate | 0 | B |
| 22 | 37 | 15 | 0 | Severe | 1 | D |
| 9 | 8 | -1 | 1 | On-Time | 0 | D |
| 18 | 18 | 0 | 1 | On-Time | 0 | D |
| 11 | 9 | -2 | 1 | On-Time | 0 | B |
| 19 | 24 | 5 | 0 | Moderate | 0 | D |
| 13 | 28 | 15 | 0 | Severe | 1 | B |
| 17 | 17 | 0 | 1 | On-Time | 0 | B |
| 18 | 16 | -2 | 1 | On-Time | 0 | D |
| 12 | 12 | 0 | 1 | On-Time | 0 | B |
The modeling approach presented below is structured to progressively explore upstream lead-time volatility from multiple analytical perspectives.
Rather than treating each dashboard as a standalone view, the models are designed to be read sequentially, with each one answering a distinct layer of the same problem.
Model 1 establishes diagnostic visibility by highlighting where and how lead-time variability manifests across suppliers and commodities.
Model 2 builds on this foundation by classifying suppliers based on reliability and exposure, helping distinguish critical risk from manageable variability.
Model 3 extends the analysis into forward-looking indicators that signal where lead-time risk may emerge next.
Together, these models provide a structured lens for interpreting volatility, supporting informed discussion rather than prescriptive solutions.
Model 1: Supplier Performance Diagnosis Dashboard
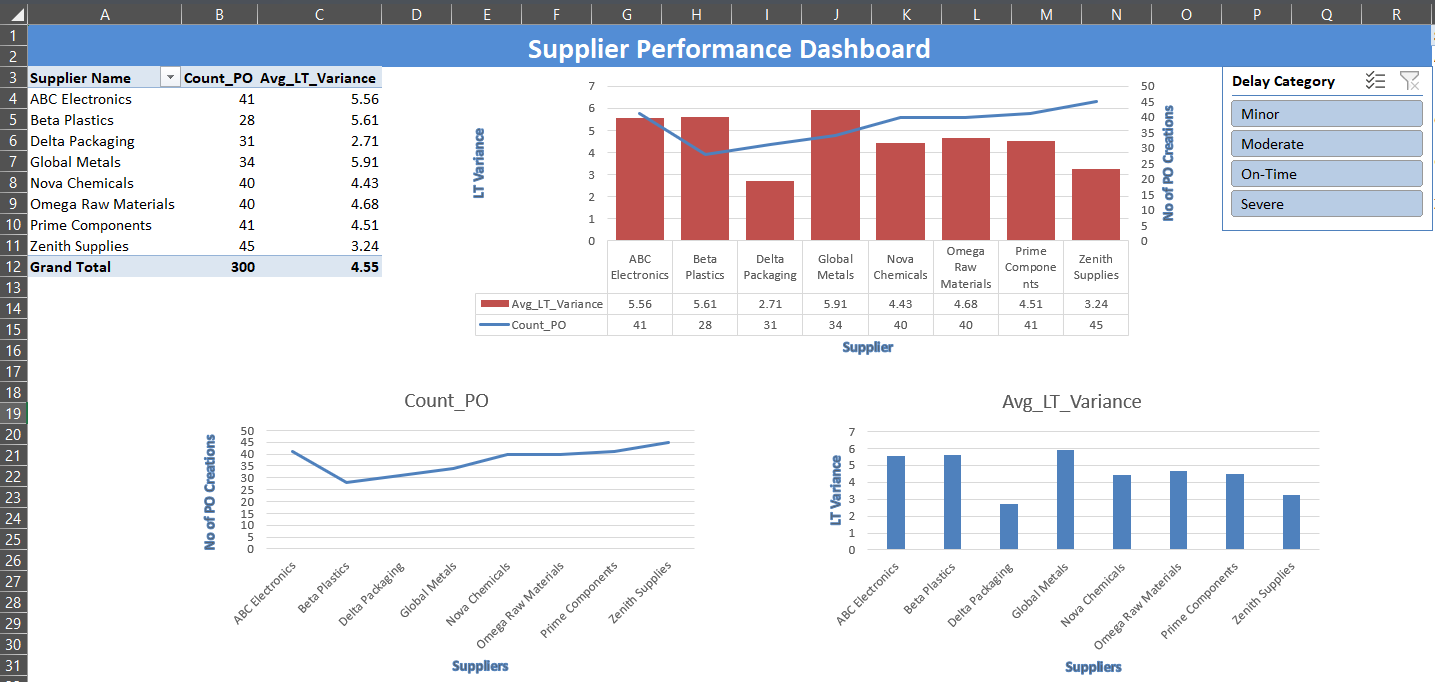
Insights of Model 1: Supplier Performance Dashboard
The average lead-time variance among suppliers is around 4.5 days, reflecting moderate variability when all deliveries, including on-time and minor delays, are considered.
Suppliers like Zenith Supplies and Prime Components record the highest number of purchase orders, indicating significant transactional volume and supply chain activity.
Including all delay types gives a balanced view, capturing not only the delays but also the successful, on-time deliveries, which helps contextualize supplier reliability.
This broad scope is useful for understanding general supplier behavior and detecting overall variability trends that affect supply chain stability.
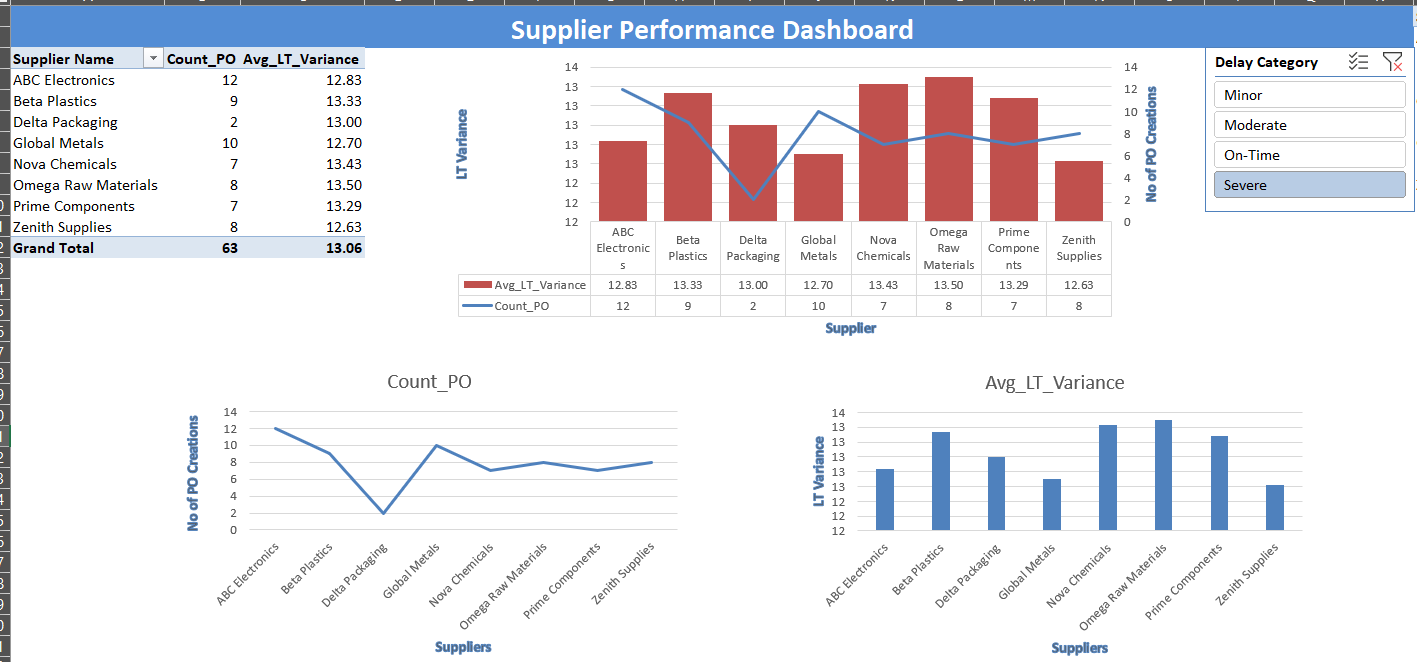
Severe Delay Category Dashboard:
Focusing on severe delays reveals that a few critical suppliers and commodities account for the majority of extreme delivery deviations. This highlights concertrated risk areas that may require targeted attention in upstream planning.
The average lead-time variance jumps significantly to around 13 days, highlighting that severe delays cause much larger disruptions compared to minor or moderate delays.
The total number of purchase orders is much lower (63 compared to 300 in the full set), showing that severe delays affect fewer orders but have outsized consequences.
Suppliers such as Beta Plastics, Nova Chemicals, and Omega Raw Materials demonstrate notably high lead-time variances under severe delays, marking them as critical risk areas requiring targeted attention.
This focused view enables identification of key bottlenecks and suppliers that contribute disproportionately to lead-time unpredictability.
Comparison of All Delay Categories and Severe Delay Only:
Lead-Time Variance: Severe delays drive substantially higher lead-time variance, emphasizing their outsized impact on supply chain reliability, even though they represent a smaller portion of total orders.
Volume vs. Risk: While high-volume suppliers may appear moderately reliable in the full dataset, isolating severe delays uncovers hidden risks that might otherwise be masked.
Prioritization: The severe delay analysis acts as an early warning system, allowing supply chain managers to prioritize corrective actions where delays cause the most harm, while the all-category view supports broader supplier performance monitoring.
Balanced Understanding: Combining both views is essential; addressing severe delays mitigates the largest disruptions, and tracking all delay types ensures gradual performance improvements and early detection of emerging issues.
Model 2: Supplier Reliability Classification Dashboard
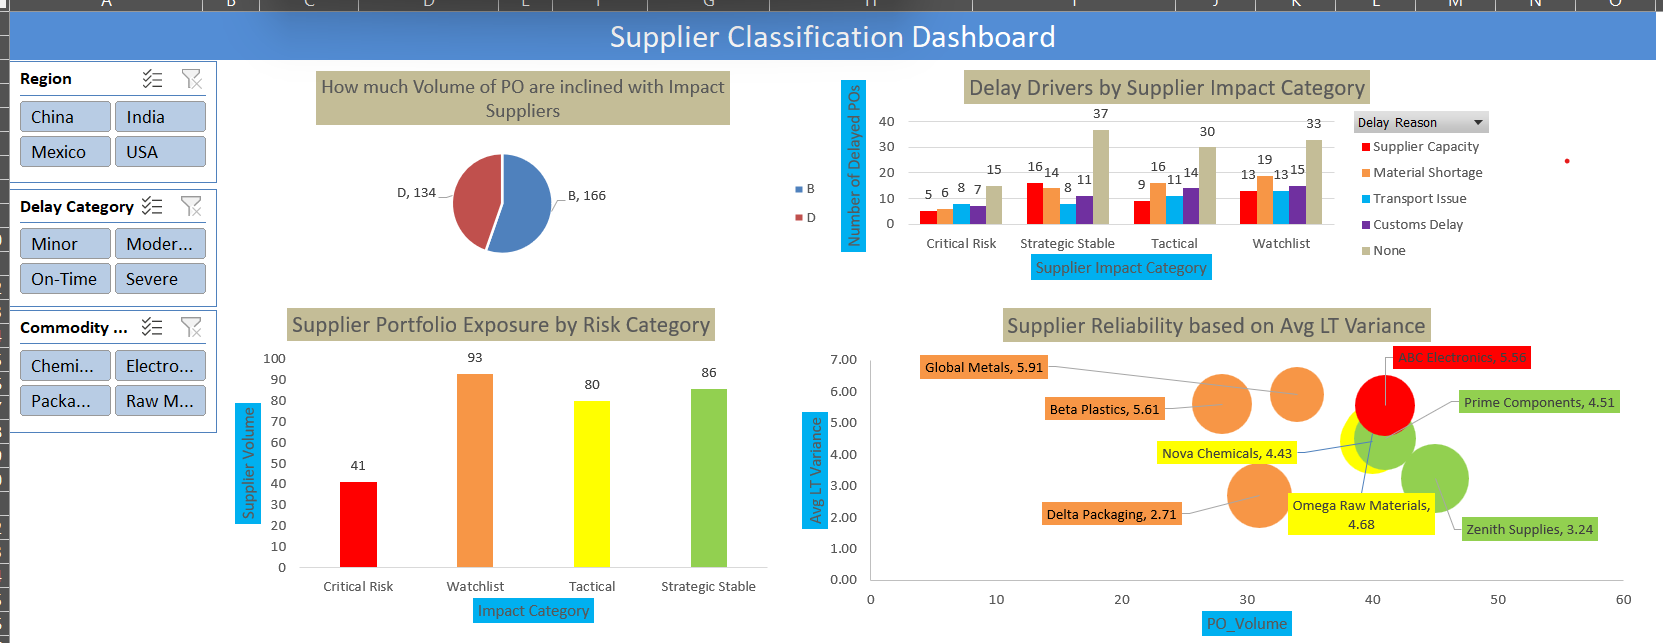
This Model highlights that supplier risk is concentrated: a small set of suppliers with high exposure and low reliability drive critical risk to the supply chain, while the majority remain strategically stable or tactical. This classification allows prioritization of supplier management and targeted risk mitigation.
Key Insights for Supply Chain Leadership
1. Risk Is Concentrated, Not Evenly Distributed
A significant portion of total PO volume is concentrated among a small group of high-exposure suppliers, amplifying the impact of any reliability failure. The dashboard highlights that Critical Risk and Watchlist suppliers together account for a disproportionate share of portfolio exposure, signaling elevated continuity and service-level risk.
2. High Volume Does Not Always Mean High Risk
Not all high-exposure suppliers are problematic. The Strategic Stable segment demonstrates that suppliers with large PO volumes can still deliver consistently when reliability fundamentals are strong. This distinction prevents unnecessary escalation and enables organizations to protect strategic partnerships while identifying and isolating true risks.
3. Delivery Volatility Is a Strong Early Warning Signal
Suppliers classified as Critical Risk show materially higher average lead-time variance, making delivery predictability — not just delay frequency — a key reliability indicator. Even when on-time delivery percentages appear acceptable, volatility introduces planning instability across production and inventory.
4. Delay Root Causes Differ by Supplier Segment
The dashboard reveals that delay drivers are not uniform across impact categories:
Critical Risk suppliers are primarily affected by supplier capacity and logistics constraints
Watchlist suppliers show higher exposure to material shortages
Strategic Stable suppliers experience fewer systemic issues, with delays often being non-structural
5. Portfolio Health Can Be Actively Managed, Not Just Monitored
By classifying suppliers into Critical Risk, Watchlist, Tactical, and Strategic Stable, the dashboard enables a clear action framework:
Critical Risk: Immediate recovery plans and executive oversight
Watchlist: Targeted monitoring and risk reduction initiatives
Tactical: Performance optimization and cost leverage
Strategic Stable: Long-term partnership and volume consolidation
This segmentation transforms supplier management from scorekeeping into strategy execution.
Model 3: Supplier Risk Indicator Dashboard
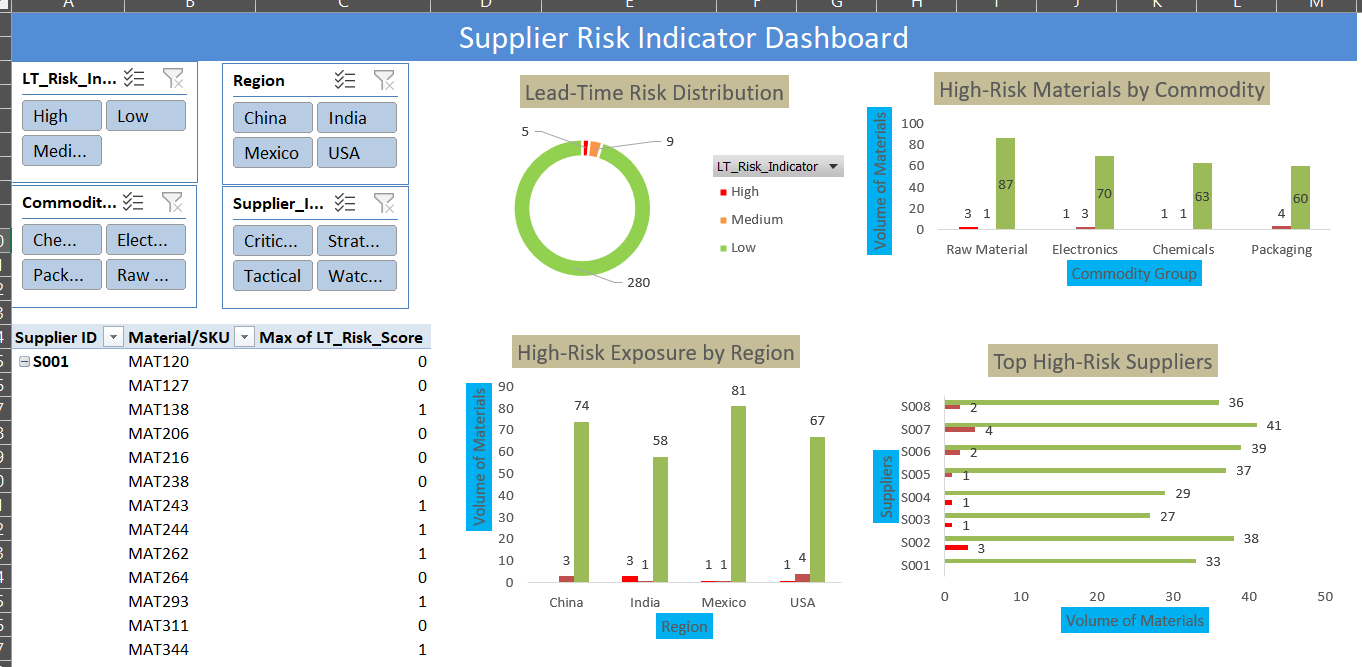
The Lead-Time Risk Indicator Dashboard extends supplier performance analysis into a forward-looking risk monitoring framework. By combining lead-time variability trends with supplier impact and material exposure, the model identifies emerging disruption risks at the supplier–material level and supports proactive planning actions.
The dashboard provides both a holistic view of overall risk distribution and a focused view of high-risk supplier–material combinations, enabling decision-makers to understand risk concentration and prioritize interventions effectively.
Key Outcomes from the Lead-Time Risk Indicator Dashboard
1. Lead-Time Risk Is Limited and Concentrated
The dashboard shows that the majority of supplier–material combinations fall under Low risk, with only a small subset classified as High risk. This indicates that lead-time volatility is not widespread but concentrated in specific areas of the supply base.
Outcome:
Risk signals are selective and actionable, avoiding unnecessary escalation across stable suppliers and materials.
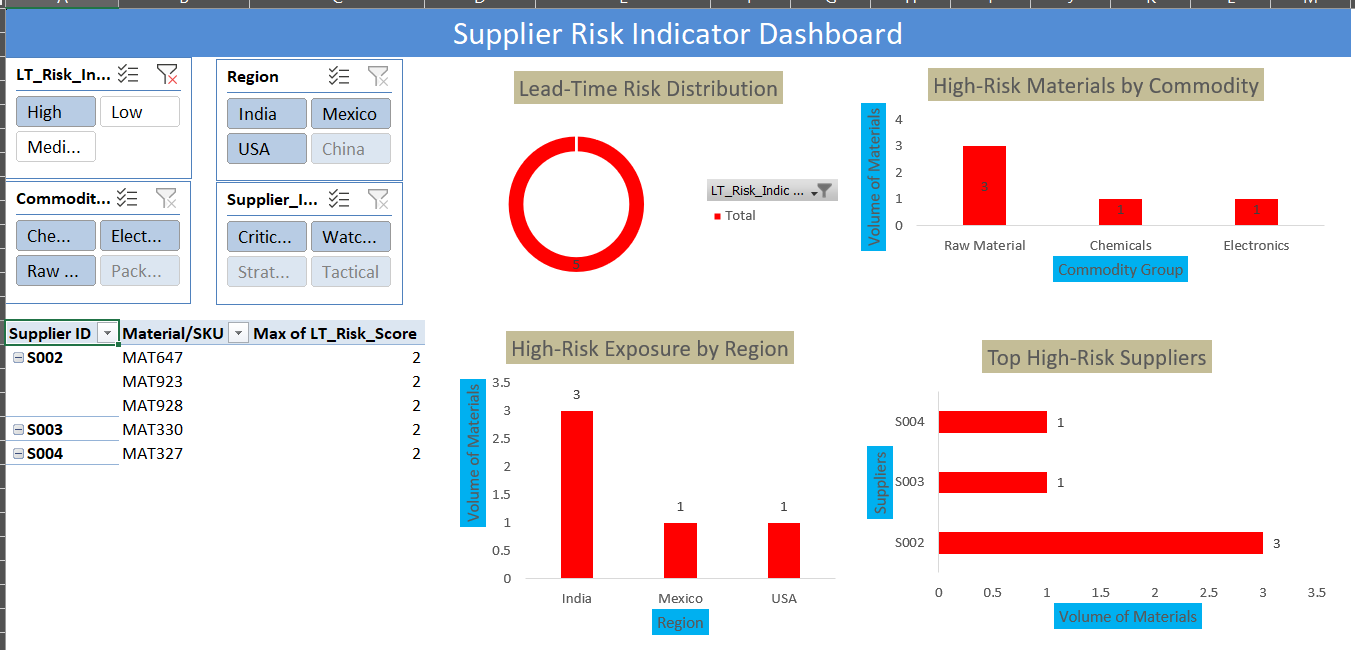
2. High-Risk Exposure Is Driven by Specific Materials
High-risk indicators are primarily associated with a limited number of materials, rather than entire commodity groups or suppliers. Raw materials account for the largest share of high-risk exposure, followed by selected chemical and electronic components.
Outcome:
Material-level risk identification enables targeted buffer and safety stock adjustments instead of broad inventory increases.
3. Supplier Risk Manifests at the Material Level
The analysis reveals that some suppliers classified as reliable or stable still exhibit high-risk behavior for specific materials. This confirms that supplier-level reliability alone does not capture material-specific lead-time volatility.
Outcome:
Risk assessment must be performed at the supplier–material intersection to ensure accurate identification of emerging issues.
4. Regional Patterns Influence Lead-Time Risk
High-risk materials show regional concentration, with certain sourcing regions contributing a greater share of risk signals. This suggests the influence of region-specific factors such as logistics dependencies, capacity constraints, or upstream disruptions.
Outcome:
Regional risk patterns can be incorporated into sourcing strategy, planning calendars, and escalation priorities.
5. Early-Warning Signals Support Proactive Planning
The Lead-Time Risk Score identifies cases where risk momentum is increasing, even if current delivery performance appears acceptable. These signals allow planners to intervene before delays impact production or customer service.
Outcome:
The organization shifts from reactive delay management to proactive risk prevention.
6. Risk Indicators Translate Directly into Planning Actions
Each high-risk signal can be mapped to concrete operational responses, including:
Temporary safety stock increases
Buffer lead-time adjustments
Supplier escalation and review
Alternate sourcing evaluation
Outcome:
The dashboard closes the gap between analytical insight and execution-level decision-making.
Through the analysis of supplier performance, material volatility, and lead-time variability, several key strategies emerge to guide proactive planning.
1. Prioritize High-Risk Supplier–Material Combinations
Not all suppliers or materials carry the same risk. Focus attention, safety stock, and buffer adjustments on those combinations where lead-time risk is rising. Low-risk items can follow routine processes, ensuring resources are allocated efficiently.
2. Monitor at the Material Level, Not Just Supplier Level
Aggregate supplier reliability scores may hide risks. Track each material individually and engage suppliers when specific products show early signs of delay. This prevents small issues from becoming large disruptions.
3. Act on Early-Warning Indicators
Lead-time variance, rising delays, and severe delay flags are signals to intervene before service is affected. Use these metrics to trigger proactive actions such as alternate sourcing, accelerated ordering, or buffer adjustments.
4. Apply Exception-Based Planning
High-risk items typically represent a small portion of the portfolio. Concentrate review and intervention efforts on exceptions—high- and medium-risk items—while letting low-risk items proceed through standard workflows. This approach reduces workload without sacrificing responsiveness.
5. Consider Regional and Commodity Patterns
Certain regions or commodity groups show clustered risk. Adjust sourcing, logistics, and inventory strategies to account for regional constraints or supply chain dependencies.
6. Foster Risk Awareness Across Teams
Share dashboards and indicators across procurement, planning, and operations. Encourage discussions based on data-driven insights rather than assumptions, building a culture of proactive risk management.
7. Use Risk Scores as Guidance, Not Rules
Treat the risk indicators as a decision-support tool. Planners should evaluate the context before deciding on buffers, alternate sourcing, or escalation. This ensures flexibility and informed judgment in operational decisions.
Bottom Line:
By focusing attention on high-risk areas, acting early on emerging threats, and embedding risk awareness across teams, the organization can reduce disruptions, optimize inventory, and improve supply chain resilience—without overcomplicating planning processes.
The project followed a structured journey, beginning with a clear problem statement and gathering real-time evidence to frame the supply chain lead-time challenges. The initial step involved designing a data structure aligned with the problem requirements, followed by data collection and cleaning in Excel. Derived variables were created to capture key metrics, forming the foundation for subsequent modeling.
Modeling was conducted in multiple stages, leveraging Excel formulas, PivotTables, data modeling, and DAX to construct Models 1 through 3. These models enabled a progressive understanding—from diagnosing volatility and supplier reliability to anticipating emerging lead-time risks. Throughout the modeling process, iterations were necessary; Model 3, for example, was initially designed to assess all suppliers and materials, but insights from dashboards later refocused attention specifically on high-risk items and their corresponding suppliers.
Pivot analyses and Excel charts, enhanced with slicers and conditional formatting, were used to visualize findings and create interactive dashboards. These dashboards enabled clear observation of risk distribution across suppliers, materials, regions, and commodities, highlighting areas that required proactive intervention. Key challenges encountered included establishing reference evidence due to portal restrictions and ensuring consistent color formatting in data-model-driven PivotTables.
The project was conducted solo, requiring hands-on effort at every stage—from data handling to strategy derivation. Automation tools were not used, though AI-assisted tools like Copilot and Google Colab were employed to gather raw data efficiently.
Overall, the combination of Excel for data management and modeling, along with visual dashboards for insight communication, allowed the project to translate raw data into actionable, risk-aware supply chain strategies.
This project demonstrates how structured data analysis and modeling can transform raw supply chain information into actionable insights. By systematically examining supplier performance, material-level lead-time variability, and regional risk patterns, the models highlight areas that require proactive intervention.
Key lessons include the importance of focusing on high-risk suppliers and materials, leveraging dashboards for clear visualization, and translating data signals into strategic planning actions. The approach shows that even in complex supply chains, targeted, risk-aware decision-making can improve responsiveness, optimize inventory, and prevent disruptions before they impact operations.
Ultimately, this journey highlights the importance of integrating analytical rigor, visualization, and practical strategy, offering a framework that can inform real-world supply chain decisions.
This project journey illustrates how structured analysis, modeling, and visualization can turn raw supply chain data into actionable insights. By integrating historical trends, supplier performance, and lead-time risk indicators, we were able to provide a framework for proactive, data-driven decision-making.
The experience also reinforces the importance of iterative refinement, careful data handling, and effective visualization to communicate complex findings clearly to stakeholders.
I hope this exploration provides practical lessons and inspiration for supply chain professionals, analysts, and anyone interested in leveraging data to anticipate risks and optimize operational efficiency.
Thank you for taking the time to read through this journey.